Cold Market vs Hot Market Examples
$900,000 Home (High End) - Slow Selling Market
Average Sales Price
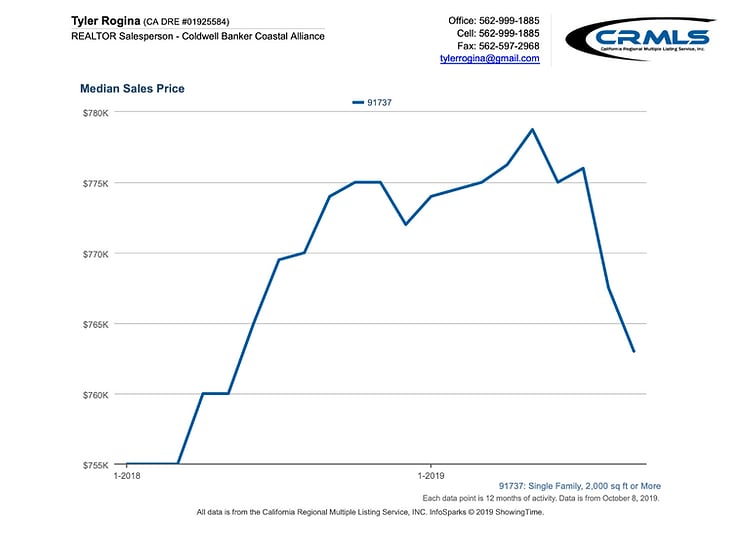
You can see the NEGATIVE pressure from these data points the market is slowing down in this higher-end price point with the average days on the market trending higher YTD and the average sales prices trending lower YTD.
Average Days on the Market
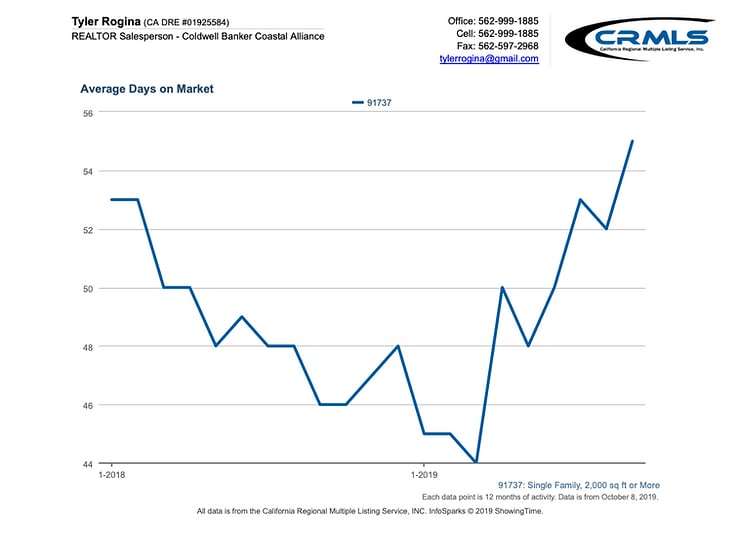
The market, nationwide, for premium and luxury homes for sale continue to grow. In an article by realtor.com, the year-over-year inventory of luxury homes has grown by 4.7%. In this cold, slow selling market, buyers will find themselves with an upperhand.
$650,000 Home (Mid Range) - Hot Selling Market
Average Sales Price
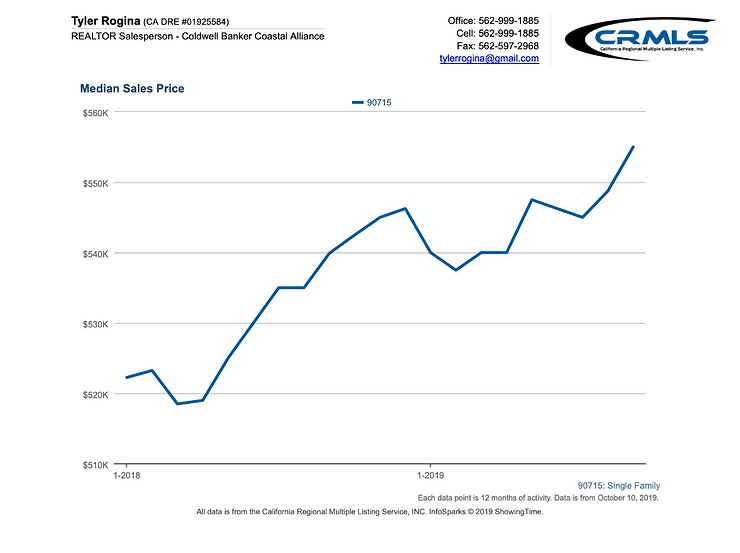
You can see the POSITIVE pressure from these data points that the market is still HOT in this Mid-range price point with the average days on the market trending lower YTD and the average sales prices trending higher YTD.
Average Days on the Market
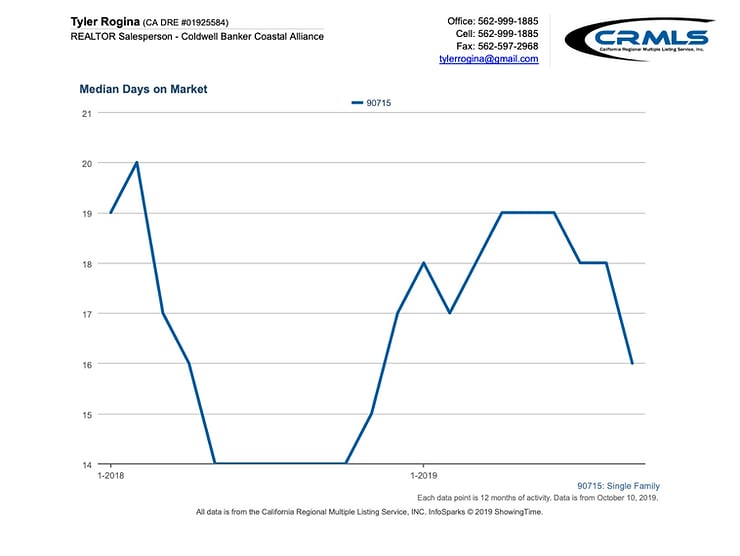
Housing inventory for starter and mid-range homes continue to be below the 6 month supply. This low supply increases competition, drives bidding wars, and sets up the opportunity for homes to be sold above asking price. As shown in the graphs above, the average price increases as the days on the market decreases. In this hot and upward trend, we find ourselves in a seller's market.
Key Highlights
Sellers
Put yourself in a good position to make a sound decision by working with an agent to decipher if it is a good time for you to put your property on the market right now.
Buyers
As seen in our first example, sellers are desperate. It may be the best time for you to get into the home that you want!